Frank Serafini's Guides to Visual Comprehension
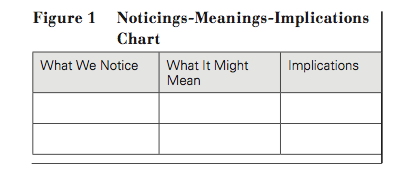
Serafini's entire article is worth a read, but within the context of the article he provides several excellent guides for use with students in learning to comprehend visually. One is the “Noticings-Meanings-Implications” chart.
“Noticings-Meanings-Implications calls students’ attention to the elements in a multimodal text. . . Teachers can use this chart to help students move from what they notice to constructing meanings, and then to then to considering meanings in the sociocultural contexts in which meanings are generated” (2011, p. 344-345).
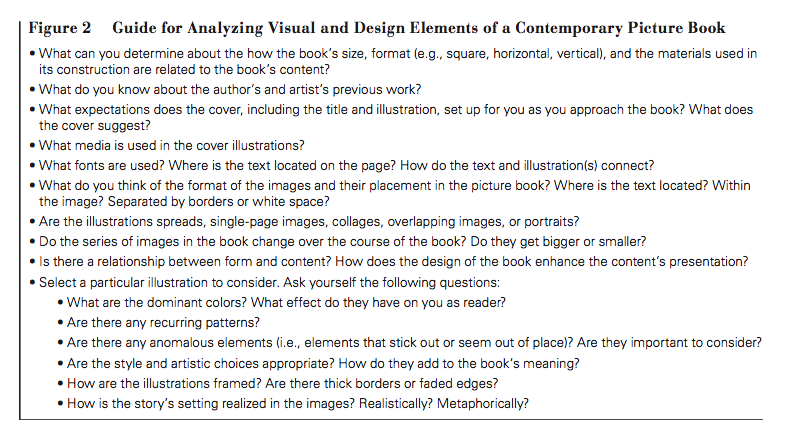
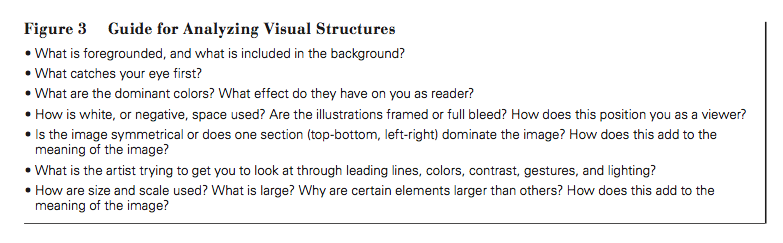
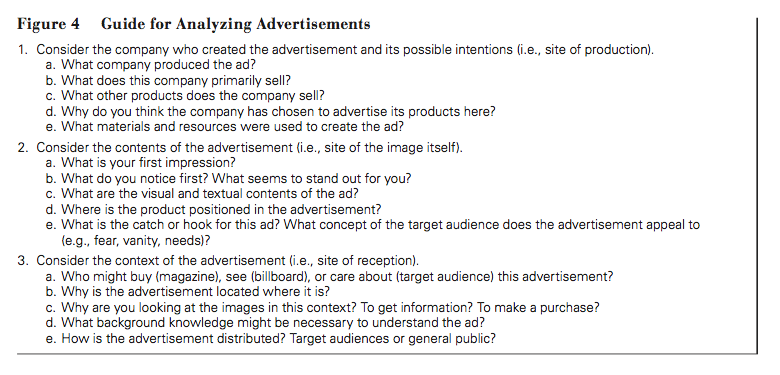
He has also created question guides for the “Three structures, or components, of visual grammar that are essential for comprehending visual images and multimodal texts: (1) composition, (2) perspective, and (3) visual symbols” (2011, p. 345-346), as well as a guide for analyzing advertisements.
Serafini, F. (2011). Expanding perspectives for comprehending visual images in multimodal texts. Journal of Adolescent and Adult Literacy, 54(5), 344-350.
“Noticings-Meanings-Implications calls students’ attention to the elements in a multimodal text. . . Teachers can use this chart to help students move from what they notice to constructing meanings, and then to then to considering meanings in the sociocultural contexts in which meanings are generated” (2011, p. 344-345).
He has also created question guides for the “Three structures, or components, of visual grammar that are essential for comprehending visual images and multimodal texts: (1) composition, (2) perspective, and (3) visual symbols” (2011, p. 345-346), as well as a guide for analyzing advertisements.
Serafini, F. (2011). Expanding perspectives for comprehending visual images in multimodal texts. Journal of Adolescent and Adult Literacy, 54(5), 344-350.
Terri Sosa's Ideas for Teaching Design
Terri Sosa provides some practical and simple ideas for teaching the basic principles of design. In working with college students, she focused specifically on “Balancing of images and text on a page . . . Use of fonts . . . Displays of word art (and other graphical text) . . . Color . . . Selection of applicable images . . . Appropriate spacing.”
She recommends, “. . . two popular design books, The Non-Designers Design Book by Robin Williams and The Non-Designers Web Book by Robin Williams and John Tollett. Both books provide detailed discussions and examples of visual design principles. Students used checklists in The Non- Designers Web Book to practice identifying “design that works” (2009, p. 57).
Sosa, T. (2009). Visual literacy: The missing piece of your technology integration course. TechTrends, 53(2), 55-58.
Glenda Rake's Crash Course in Vis-Lit
Glenda Rakes says that, “Visual elements are like the words of a visual sentence. The more "words" students can use, the better the chance successful communication will occur.”
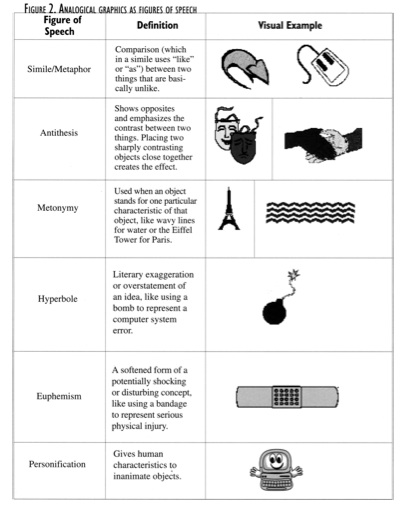
She identifies that most visual elements “can be placed within three major categories.” These categories are representational graphics, where the image resembles the object; analogical graphics, where the two images share a similarity, and abstract graphics, where the idea is represented graphically, as in a graph or chart.
Rake’s article provides background research and practical activities for the teaching of visual literacy. It would be an excellent article for a staff to read and discuss as a kick-off to intentional teaching of visual literacy.
Rakes, G. (1999). Teaching visual literacy in a multimedia age. TechTrends, 43(4), 14-18.